


You know how important it is to keep your clients informed and impressed with your work. But reporting results can sometimes feel overwhelming or confusing.
What if you had a clear, simple way to share your progress that highlights your success and builds trust? You’ll discover easy-to-use templates and real examples that make reporting results to clients straightforward and effective. By the end, you’ll have the tools to create reports that not only show your value but also keep your clients excited about what’s coming next.
Ready to transform your client reports? Let’s dive in!
Client reports must be clear and focused. They show results and build trust. Every report should highlight what matters most to the client. Keeping reports simple helps clients understand progress easily. Strong reports guide future decisions and improve collaboration.
Choose metrics that match the client’s goals. Common metrics include traffic, conversions, and sales. Show how these numbers changed over time. Use clear labels and avoid jargon. Visual charts help make data easier to digest.
Briefly describe what was done during the campaign. Mention key actions like ads run or posts published. Highlight any challenges faced and how they were solved. This summary explains the context behind the results. Keep it short and focused on what matters most.
Start every report with clear objectives. Define what success looks like for the client. Objectives help measure progress and guide future work. Use simple language to state goals. Clear objectives make reports more meaningful and actionable.
Designing effective templates is essential for clear client communication. A well-crafted template helps present data and insights in a clean, organized way. It saves time and ensures consistency across reports. Clients can easily understand the results and see the value of your work. Focus on simple design choices that improve readability and engagement.

Start with a clear layout that guides the reader. Use a grid to align text, images, and charts neatly. Grids create balance and structure, making the report easier to scan. Keep margins and spacing consistent to avoid clutter. Prioritize important information by placing it in prominent spots. A simple one- or two-column layout works well for most reports.
Pick colors that reflect your brand or the client’s identity. Use a limited color palette to keep the design clean. Choose high-contrast colors for text and backgrounds to improve readability. Soft, neutral tones work well as backgrounds to reduce eye strain. Use accent colors sparingly to highlight key data or headings. Avoid bright or clashing colors that distract the reader.
Select fonts that are easy to read on screens and print. Sans-serif fonts like Arial or Helvetica are great for body text. Use one or two font families to keep the design simple. Define font sizes for headings, subheadings, and body text to create hierarchy. Maintain consistent font styles for bold, italics, and links. A style guide helps ensure uniformity across all client reports.
Data visualization techniques play a crucial role in reporting results to clients. They turn raw data into clear visuals that clients can quickly understand. Visuals help highlight key points and make the report more engaging. Using the right techniques ensures your message is delivered effectively.
Graphs and charts simplify complex data. Line charts show changes over time clearly. Bar charts compare different categories side by side. Pie charts display proportions in an easy-to-grasp format. Choose the chart type that fits your data best. Use colors to differentiate data points for better clarity.
Infographics combine images and data for quick understanding. They tell a story visually and keep the reader interested. Use icons, symbols, and brief texts to explain data. Infographics work well for summarizing key results and processes. Keep the design clean and avoid overcrowding with too much information.
Spotting trends helps clients see the bigger picture. Use arrows or color highlights to draw attention to key trends. Show growth, decline, or patterns clearly with visuals. Explain why these trends matter in simple words. Highlight trends that impact client goals directly to keep focus.
Automation and tools simplify how you report results to clients. They save time and ensure accuracy. Using the right tools makes reports clear and professional. Automation reduces manual work and speeds up the process. Clients get timely, consistent updates without extra effort.
Report builders help create reports quickly. They offer templates and drag-and-drop features. You can customize layouts to match your brand. Many builders include charts and graphs for easy data display. These tools do not require advanced skills. They make report creation accessible to everyone.
Combining data from various sources improves report quality. Tools connect to platforms like Google Analytics and social media. This integration pulls data automatically into one report. It avoids manual copying and errors. Clients see a full picture of campaign performance. Integration saves time and keeps data up-to-date.
Scheduling features let you set automatic report delivery. You can choose how often reports send, such as weekly or monthly. Reports arrive in clients’ inboxes without delays. This keeps communication consistent and professional. Automation frees you from manual sending tasks. Clients stay informed without extra follow-up.
Writing clear insights is vital for effective client communication. Insights turn raw data into understandable stories. They help clients see the value behind the numbers. Clear insights build trust and guide clients toward informed decisions. Avoid jargon and keep explanations simple. Focus on what the results mean, not just what they show.
Explain results in simple terms. Highlight trends and patterns clearly. Compare data against goals to show progress. Use visuals to support your points. Make sure clients understand what worked and what did not. Avoid technical language or complex statistics.
Give clear, practical advice based on findings. Suggest specific actions clients can take next. Prioritize recommendations by impact and effort. Use bullet points for easy reading. Link each recommendation to the insight it addresses. Help clients see how to improve results.
Outline what clients should do after the report. Include timelines for suggested actions. Offer support or resources to assist clients. Encourage feedback or questions to keep communication open. Set clear expectations for follow-up meetings or reports. Guide clients smoothly into the next phase.
Sample report structures provide a clear layout for presenting results to clients. They help organize data and insights in a way that is easy to follow. Using templates saves time and ensures consistency across reports. Different templates serve different needs, from basic to advanced layouts. Industry-specific examples show how to tailor reports for particular client types. This section explores various sample report structures for effective client communication.
The basic template includes essential sections like an introduction, key metrics, and summary. Start with a brief overview of the project goals. Next, present the main data points clearly. Use simple charts or tables to highlight performance. End with a short conclusion and recommended next steps. This format suits small projects or quick updates. It keeps the report concise and easy to understand.
The advanced template offers a deeper analysis and more detailed visuals. Begin with an executive summary for quick insights. Follow with sections on methodology, detailed results, and comparisons. Include charts, graphs, and data visualizations to support findings. Add a section for challenges faced and solutions applied. End with strategic recommendations for future actions. This structure works well for complex projects or long-term campaigns.
Different industries need tailored report structures to match their unique data. For marketing, include campaign performance, audience engagement, and ROI. In finance, focus on financial statements, trends, and risk analysis. For healthcare, report patient outcomes, treatment effectiveness, and compliance metrics. Each report should reflect the client’s priorities and terminology. Customizing reports builds trust and shows expertise in the client’s field.
Effective client communication is crucial when reporting results. Clear and simple language helps clients understand data easily. Good communication builds trust and shows professionalism. Use these tips to improve how you share reports and discuss outcomes with clients.
Each client has unique goals and preferences. Customize reports to match their expectations and industry terms. Focus on the metrics that matter most to them. Avoid technical jargon unless the client is familiar with it. Use visuals like charts and graphs to make data clear. Personalizing reports shows you value the client’s specific needs.
Consistent reporting creates reliability and professionalism. Use the same format and style for every report. Deliver reports on a regular schedule clients expect. This helps clients compare results over time easily. Consistency also reduces confusion and builds confidence in your work. Keep your tone and language steady throughout all communications.
Listen carefully to client comments and questions. Respond promptly with clear and respectful answers. Use feedback to improve future reports and communication methods. Stay open to suggestions and adapt to client preferences. Thank clients for their input to show appreciation. Good feedback management strengthens client relationships and ensures satisfaction.
Start with a clear overview of the client’s goals and activities. Include key metrics, performance insights, and next steps. Use simple visuals and consistent formatting for clarity. Employ report templates or tools like TapClicks to streamline data presentation and maintain professionalism.
Write a report by starting with a title and introduction. Include objectives, methods, results, and discussion. End with conclusions and references. Use clear headings and concise language. Add visuals like charts for clarity. Follow a consistent format to ensure readability and professionalism.
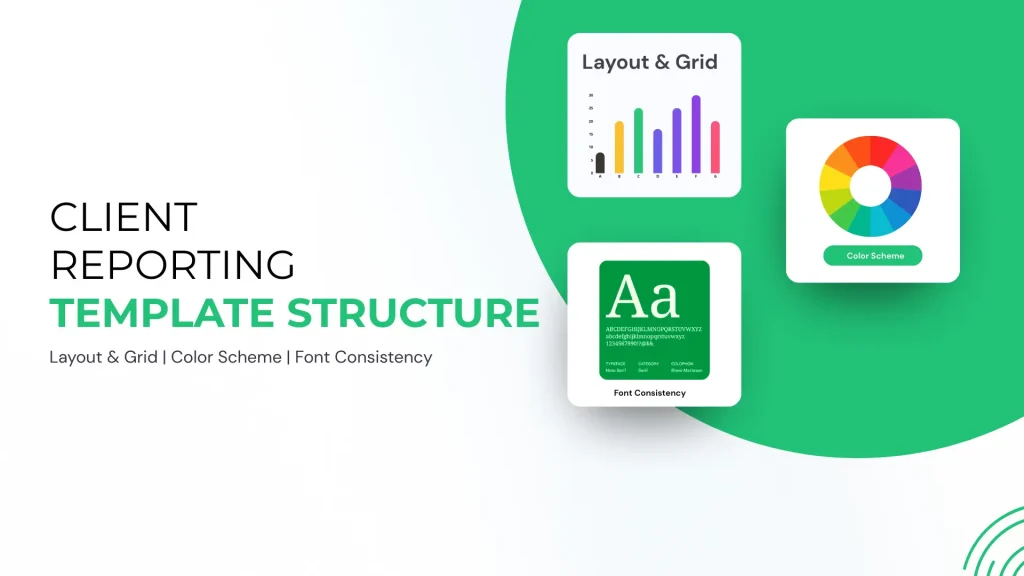
Develop a reporting template by defining layout, color scheme, fonts, and styles. Add data visuals, create reusable components, and include key metrics. Ensure clarity and consistency for easy updates and professional presentation.
The 7 steps of report writing are: 1) Define purpose, 2) Research thoroughly, 3) Organize information, 4) Draft the report, 5) Edit and revise, 6) Format properly, 7) Finalize and submit.
Clear and simple client reports build trust and show your value. Use templates to save time and keep reports consistent. Focus on key results, easy visuals, and next steps. Tailor each report to client needs for better communication. Regular updates help clients stay informed and confident.
Good reporting strengthens relationships and supports future projects. Keep improving your reports based on client feedback. Reporting well means sharing success in a way clients understand.


Leave A Reply Now