


Are you struggling to keep track of your students’ progress in a clear and organized way? Setting up a student dashboard with progress tracking and analytics can transform how you monitor learning outcomes.
Imagine having all the essential data—grades, attendance, engagement—right at your fingertips, making it easier to spot trends and act fast. In this guide, you’ll discover simple, step-by-step methods to create a powerful dashboard tailored to your needs. By the end, you’ll be equipped to track progress effortlessly and help your students reach their full potential.
Ready to take control of your classroom insights? Let’s dive in!
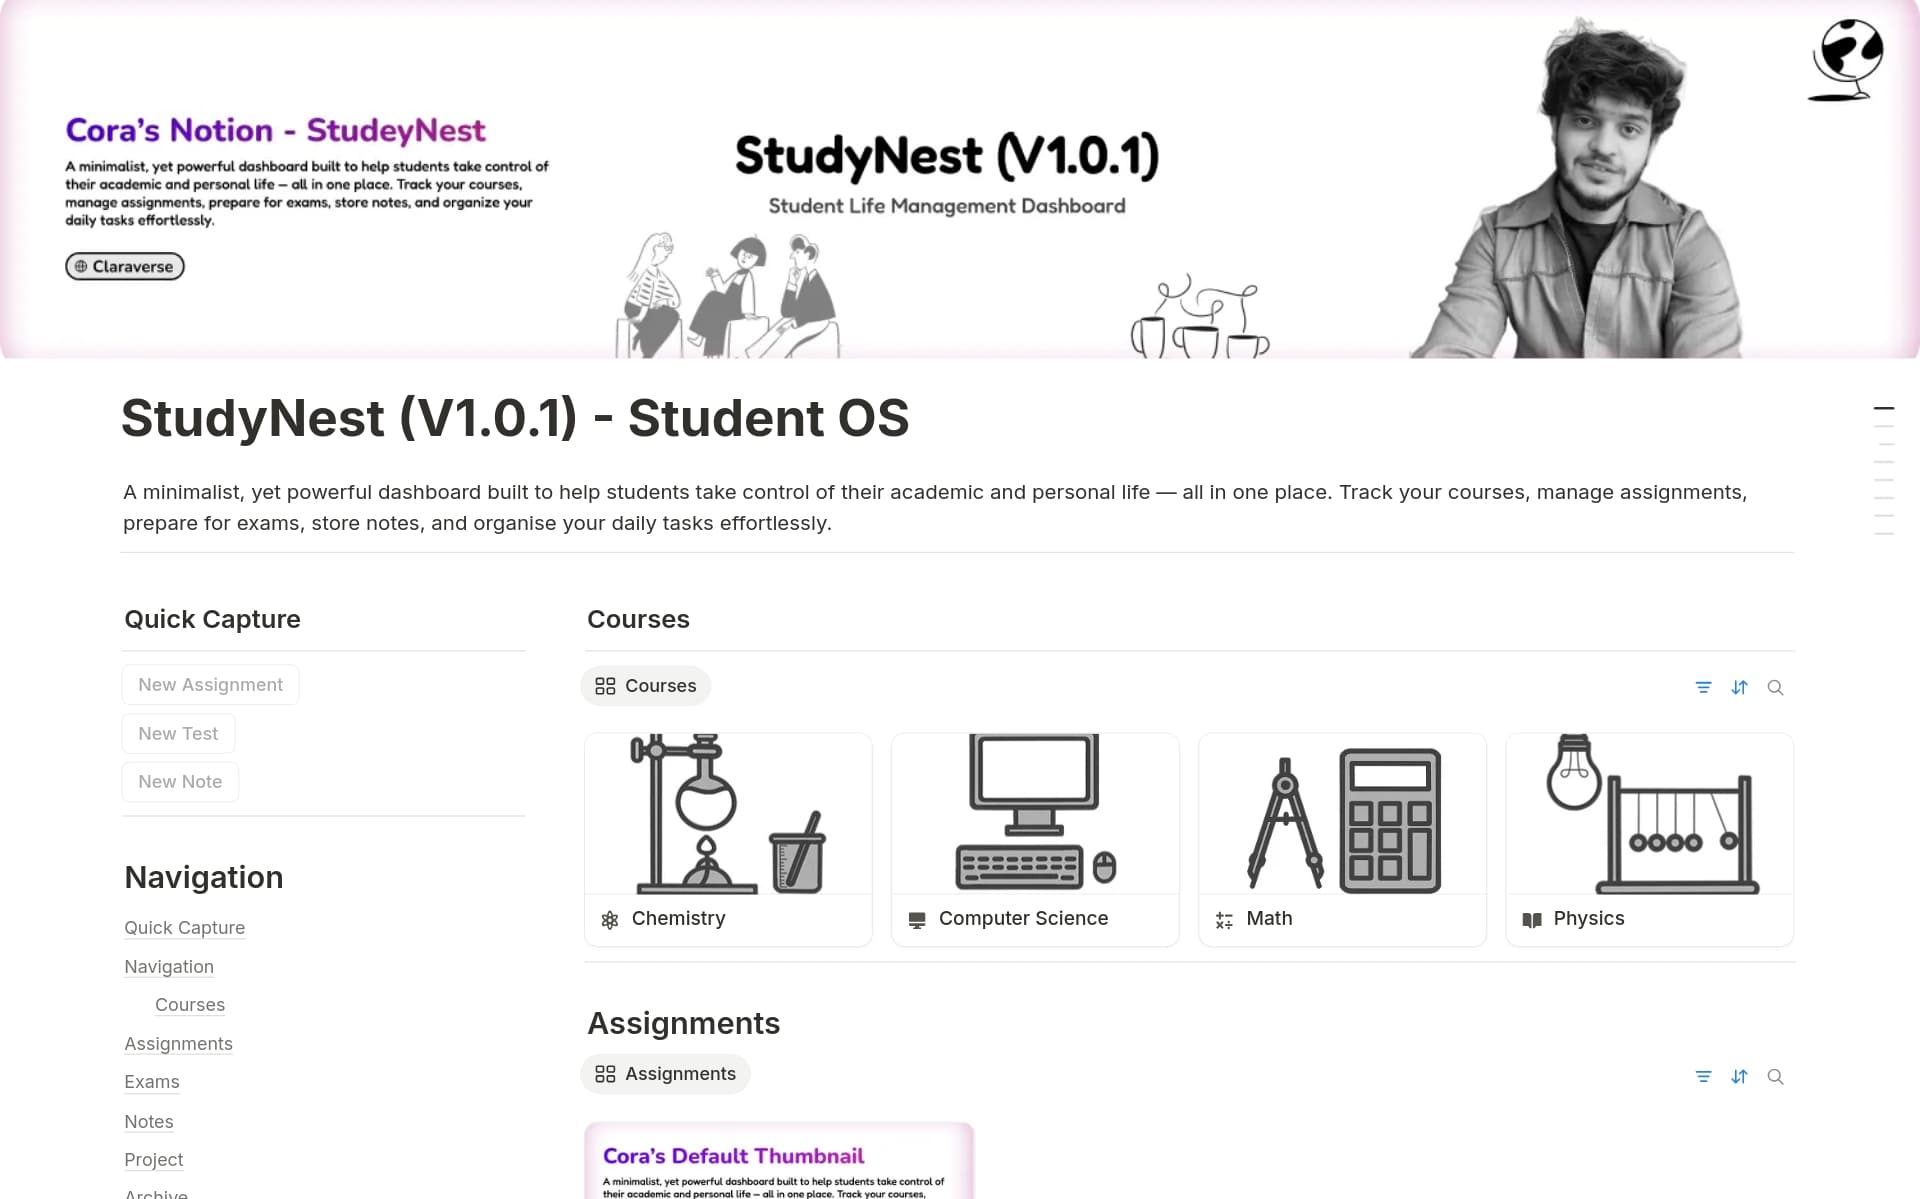
Credit: www.notion.com
Setting up a student dashboard for progress tracking and analytics starts with understanding the basics. This foundation helps you create a clear, easy-to-use system. A well-designed dashboard shows key student data at a glance. It supports teachers and students in tracking learning goals and achievements.
Keep the setup simple and organized. This makes the dashboard useful and avoids confusion. Focus on choosing the right tools, setting up user accounts correctly, and picking templates that fit your needs. These steps ensure your dashboard works well and delivers valuable insights.
Choose a platform that fits your technical skills and budget. Look for tools that support data tracking and easy updates. Consider platforms with built-in analytics and customizable features. Cloud-based platforms often provide better access and collaboration. Make sure the platform integrates with your current systems smoothly.
Set up user accounts for teachers, students, and administrators. Use clear roles and permissions to control access. This keeps data secure and organized. Assign unique usernames to avoid confusion. Provide simple instructions for logging in and using the dashboard. Regularly update accounts to maintain accuracy and security.
Pick templates that clearly display key student data. Look for designs that highlight progress, grades, and attendance. Choose templates with easy navigation and clean layouts. Templates should allow customization for your specific needs. Test different templates to find the best fit for your users.
Data integration is essential for an effective student dashboard. It brings together various types of information to provide a clear picture of student progress. Combining data from different sources helps educators make informed decisions quickly. This process improves the accuracy and usefulness of the dashboard.
Assessment data shows student knowledge and skills over time. Connect this data by linking your learning management system (LMS) or testing platform to the dashboard. Use APIs or CSV files to import grades and scores. This connection allows real-time updates and easier tracking of student performance.
Attendance records reveal student participation patterns. Import these records from school databases or attendance software. Make sure the data format matches the dashboard requirements for smooth integration. Accurate attendance data helps identify students who need extra support or follow-up.
Engagement metrics include time spent on tasks, participation in forums, and resource usage. Link these metrics from digital learning tools to your dashboard. This data helps monitor student involvement and motivation. Tracking engagement uncovers areas where students may struggle or excel.
Customizing dashboard features helps tailor the student progress tracking experience. It ensures the dashboard meets specific needs and preferences. This makes data easy to understand and use. Custom features improve engagement and provide clearer insights into student performance. Focus on key elements like progress indicators, visual analytics, and notifications.
Progress indicators show how much work a student has completed. Choose types like percentage bars, checkmarks, or numeric scores. Set thresholds to highlight milestones or areas needing attention. Adjust colors to signal progress levels clearly. Customize indicators for individual assignments or overall course completion. This makes tracking straightforward for both students and teachers.
Visual analytics turn data into easy-to-read charts and graphs. Select formats such as pie charts, line graphs, or bar charts. Use visuals to display trends over time or compare student groups. Choose colors and labels that are simple and clear. Visual elements help identify strengths and weaknesses quickly. Make sure analytics update in real-time for accurate insights.
Alerts notify users about important changes or deadlines. Set notifications for low progress, missed assignments, or upcoming tests. Choose delivery methods like email, SMS, or dashboard pop-ups. Customize alert frequency to avoid overwhelming users. Timely notifications keep students and teachers informed and proactive. This improves overall progress management and support.
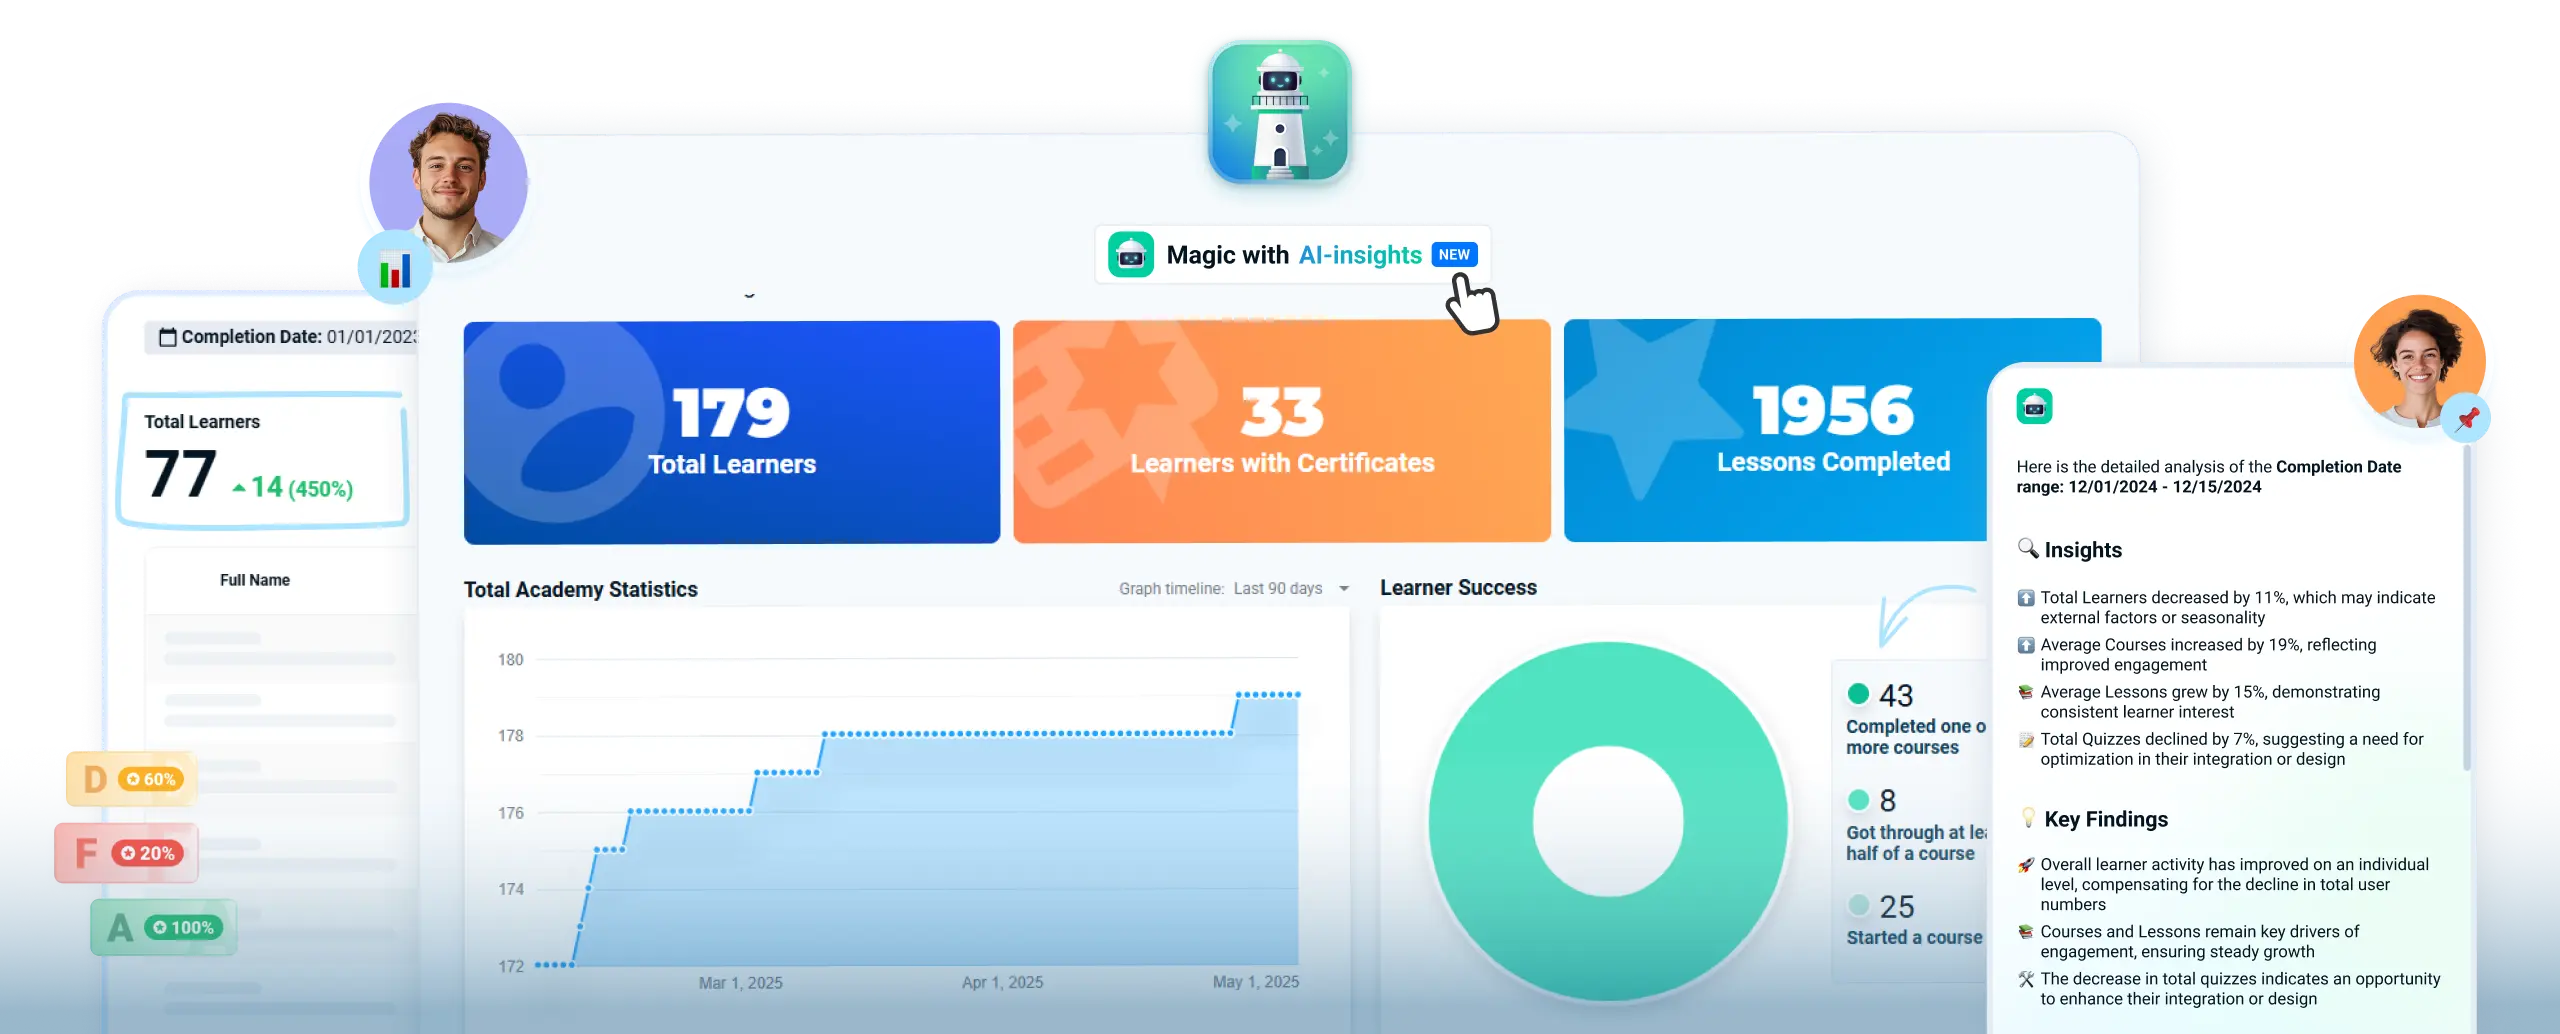
Credit: academyocean.com
Tracking student progress is essential for understanding learning achievements and challenges. It helps teachers tailor lessons and support each student effectively. A clear view of progress motivates students and guides parents on their child’s development.
The student dashboard offers tools to track progress in real-time. It shows key data points and trends. This makes it easier to spot areas needing attention and celebrate successes.
Begin by defining clear performance benchmarks. These benchmarks set the expected skill level for each subject or topic. They act as goals for students to reach within a set time.
Benchmarks help measure progress consistently across students. Use past data or curriculum standards to set these targets. Adjust them based on class needs or individual learning paths.
The dashboard provides real-time updates on student activities and scores. Teachers can see instantly who is excelling or struggling. This quick feedback supports timely interventions.
Real-time tracking also helps keep students engaged. They can view their progress immediately after completing tasks. This encourages continuous effort and self-improvement.
Filters allow detailed analysis of student data on the dashboard. You can sort by date, subject, or student groups. This helps identify trends and specific learning gaps.
Using filters saves time and improves focus. Teachers can create custom views for individual students or entire classes. This customization supports better planning and targeted teaching.
Analyzing learning patterns helps teachers understand how students progress. It reveals where students excel and where they struggle. This insight guides teaching methods and improves learning outcomes. Using the student dashboard for this analysis makes tracking simple and clear.
Review individual student data to find strong and weak areas. Look at scores, completion rates, and time spent on tasks. Highlight topics where students perform well. Also, note areas needing extra support. This helps tailor lessons to each student’s needs.
Use the dashboard to compare different groups or classes. Check average scores and progress rates side by side. Spot which groups advance faster and which lag behind. This comparison helps adjust teaching strategies for better results. Group analysis encourages healthy competition among students.
Track progress data over weeks or months to see trends. Notice if student performance improves, stays steady, or declines. Detect seasonal patterns, like dips during holidays or exam stress. This long-term view helps plan interventions early. Consistent tracking ensures no student falls behind unnoticed.
Generating reports is a crucial part of tracking student progress. It helps teachers and administrators see how students perform over time. Reports provide clear data, making it easier to spot strengths and weaknesses. This section covers how to create, share, and export these reports effectively.
Progress summaries give a quick overview of student achievements. Use your dashboard tools to select the time frame and subjects. The system will compile scores, attendance, and participation data. Summaries highlight trends and key points in student learning. Keep summaries clear and concise for better understanding.
Sharing reports keeps everyone informed. Stakeholders include parents, teachers, and school leaders. Use built-in options to send reports via email or messaging platforms. Set permissions to control who can view or edit the reports. Timely sharing promotes collaboration and supports student growth.
Exporting data allows deeper analysis outside the dashboard. Choose formats like CSV or Excel for compatibility. Exported files can be used in other software for custom reports or charts. Regular exports help maintain records and track long-term progress. Keep data organized for easy access and review.
Enhancing user experience is key to effective student dashboard progress tracking. A well-designed dashboard keeps students and educators engaged. It makes data easy to understand and use. Clear visuals and simple controls reduce confusion. Easy access to relevant information helps users stay focused.
Good user experience encourages regular use. It supports better learning outcomes. The following sections cover ways to improve navigation, customize roles, and gather feedback.
Organize dashboard elements logically. Group related data and tools together. Use clear labels for each section. Include a search bar for quick access. Add breadcrumb trails so users know their location. Simple menus and consistent layouts reduce frustration. Fast loading times keep users engaged. Avoid clutter by showing only key information.
Assign different roles for students, teachers, and admins. Each role should see data relevant to them. Limit access to sensitive or advanced features. Allow teachers to add comments and track class progress. Students can view their own progress and goals. Admins get full control for managing users and settings. Role customization improves security and usability.
Provide easy ways for users to give feedback. Include simple forms or rating options on the dashboard. Regularly review feedback to identify issues and improvements. Show users that their input matters by making updates. Use surveys to gather detailed opinions. Feedback helps create a user-focused dashboard. It ensures continuous improvement and satisfaction.

Credit: lovable.dev
Keeping student data safe is crucial when setting up a progress tracking dashboard. Protecting this information builds trust and meets legal standards. It also prevents unauthorized access and data loss. Follow key steps to ensure data security in your student dashboard.
Limit dashboard access to authorized users only. Use strong passwords and multi-factor authentication. Assign roles based on user needs to control what data they can see or edit. Regularly review access rights to remove unnecessary permissions. This reduces the risk of data breaches.
Create regular backups of all dashboard data. Store backups securely in separate locations. Use automated backup tools to avoid missing important updates. Test backups periodically to ensure data can be restored. This protects against data loss from system failures or cyberattacks.
Follow privacy laws and regulations like FERPA or GDPR. Collect only necessary student information. Inform users about data collection and usage. Use encryption to protect data in transit and at rest. Conduct staff training on privacy policies to keep everyone aware of their responsibilities.
Create a student dashboard by selecting key metrics like grades and attendance. Use tools like Excel or no-code platforms. Customize templates, input data, and visualize progress clearly. Regularly update and analyze data to track student performance effectively.
Track and monitor student progress by using regular assessments, observation, and digital dashboards. Analyze grades, attendance, and engagement consistently. Set clear goals and review data frequently to adjust teaching methods and support student growth effectively.
Create a student progress report by collecting assessment data, summarizing performance, highlighting strengths and weaknesses, and suggesting improvement steps. Use clear, concise language and proofread before sharing.
Continuously monitor student progress by using regular assessments, observing activities, and updating a tracking calendar. Utilize dashboards for real-time data on grades, attendance, and engagement to enable timely interventions.
Setting up a student dashboard for progress tracking helps teachers and students stay informed. It makes understanding learning growth simple and clear. Use easy tools to build and customize your dashboard. Track grades, attendance, and activities regularly to spot any issues early.
This approach supports better learning decisions every day. Keep the dashboard updated to reflect real-time progress. With consistent use, it becomes a helpful guide for success. Start small, then improve as you learn what works best.


Leave A Reply Now