


Are you struggling to figure out which products will bring in the biggest profits? Imagine having a clear, data-driven way to spot high-profit products before your competitors do.
By using data analytics, you can unlock hidden insights about customer behavior, sales trends, and market demands that guide you straight to the most profitable opportunities. You’ll learn how to leverage simple yet powerful data tools to make smarter decisions, boost your revenue, and grow your business faster than ever.
Ready to discover the secret to finding your next big winner? Keep reading.
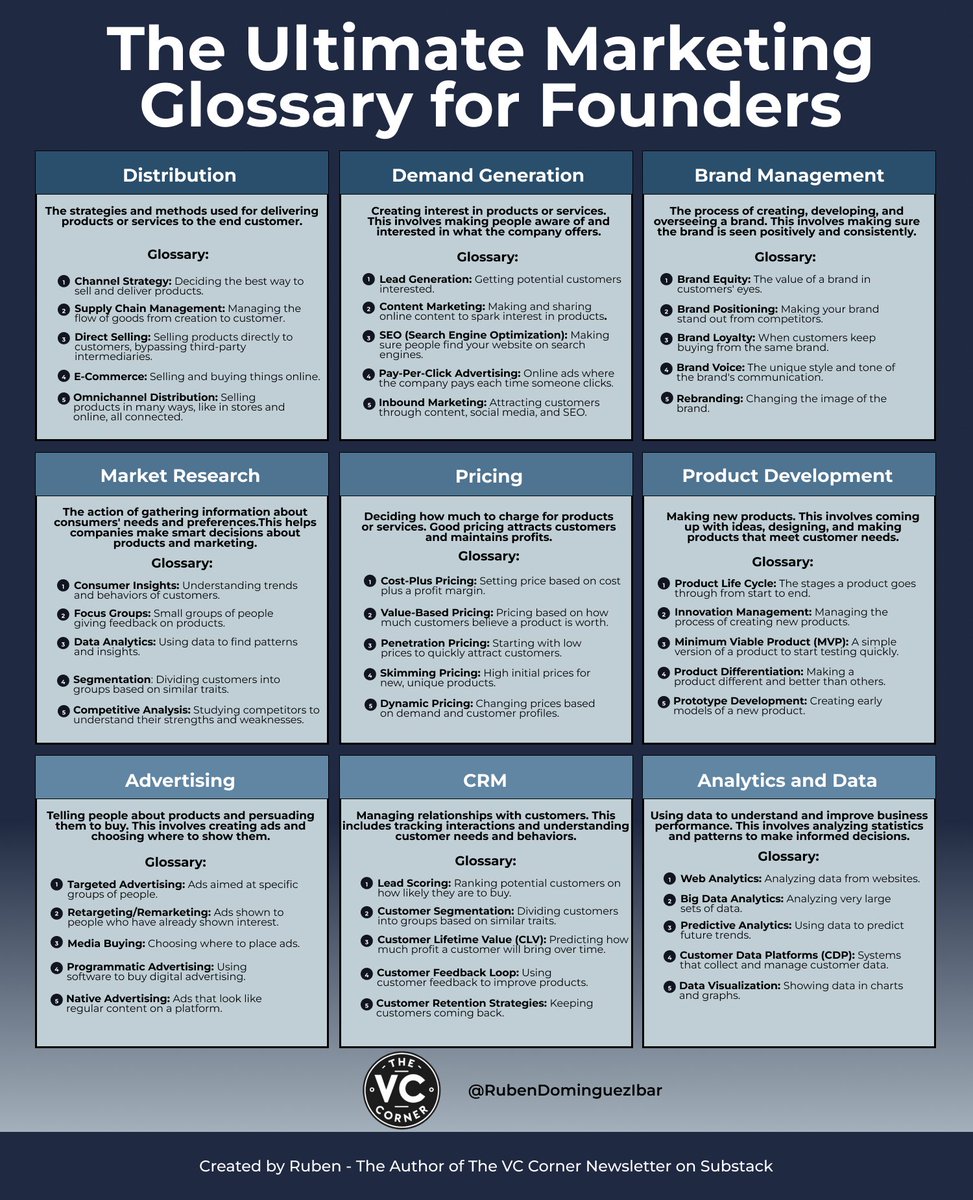
Credit: x.com
Data analytics plays a key role in increasing business profits. It helps identify products that bring the highest returns. By examining data, businesses can focus on items that sell well and have good margins.
Using data, companies avoid guesswork. They make decisions based on facts. This leads to smarter product choices and better profits.
Descriptive analytics shows what happened in the past. It uses sales reports and customer data. Diagnostic analytics digs deeper to find why sales changed.
Predictive analytics forecasts future trends. It uses patterns to guess which products will sell more. Prescriptive analytics suggests actions to improve sales and profits.
Data links directly to sales growth. Analyzing product performance helps spot winning items. Businesses can cut low-profit products and focus on top sellers.
Tracking customer preferences and buying habits also boosts sales. Data shows which products attract more buyers. Companies can adjust stock and marketing to match demand.
Identifying high-profit products is essential for any business aiming to grow and succeed. Data analytics helps uncover which products bring the most value. It reveals patterns in sales and cost that are not obvious at first glance.
Using data, businesses can focus on items that generate the highest returns. This process reduces guesswork and improves decision-making. It also helps optimize the product mix for better profits.
Sales data shows how many units of a product are sold over time. Analyzing this helps spot trends and demand cycles. Costs include production, shipping, marketing, and storage expenses. Combining sales and costs data reveals the true financial impact of each product.
Track sales volume and revenue regularly to identify strong performers. Calculate all costs linked to each product to understand expenses clearly. This step ensures that no hidden costs reduce your profit margins. It also helps spot products that sell well but have high costs.
Profitability measures how much money a product earns after covering all costs. Use formulas like profit = revenue – total costs to calculate this. Products with higher profit margins contribute more to your bottom line.
Compare profitability across products to find the best ones. Look beyond just sales numbers and consider cost efficiency. Focus on products with steady or growing profits over time. This approach highlights items that support long-term business success.
Regularly update profitability analysis to respond to market changes. Use data tools to automate and visualize this process. Clear insights lead to smarter product strategies and better resource allocation.
Making decisions based on data helps businesses find products with higher profits. Using the right tools lets you analyze large amounts of information quickly. These tools show clear patterns and trends in sales and customer behavior. They help spot products that earn the most money and reveal areas to improve.
Choosing proper tools makes your data analysis easier and more accurate. It saves time and reduces guesswork. Below are some popular options and techniques to help you make strong, data-driven decisions.
Many software tools help analyze product data. Excel is a common choice for simple data sets and calculations. It offers basic charts and pivot tables for quick insights.
For deeper analysis, platforms like Google Analytics and Tableau provide more power. Google Analytics tracks online sales and customer actions. Tableau helps visualize complex data with easy drag-and-drop features.
Other tools like Power BI and Looker combine data from many sources. They give a complete view of product performance across channels. These software options allow filtering data to find high-profit products fast.
Visual tools turn raw data into clear images. Graphs and charts show sales trends over time. Bar charts compare profits between products. Pie charts display market share percentages.
Heat maps highlight areas with the best sales or customer activity. Dashboards bring many visuals together on one screen. This helps spot patterns and outliers quickly.
Using visuals makes it easier to understand complex data. They help teams discuss findings and plan actions. Visualization turns numbers into stories that guide smart product choices.
Pricing strategies play a key role in boosting product profits. Data helps set prices that attract buyers and maximize earnings. Smart pricing adapts to market trends and customer behavior. Using data, businesses avoid guesswork and make informed decisions.
Data-driven pricing reveals patterns in sales and demand. It shows when customers are willing to pay more or less. This insight helps adjust prices for different products or times. The goal is to find the price point that brings the highest profit.
Dynamic pricing uses real-time data to change prices quickly. Algorithms analyze factors like demand, competition, and inventory. Prices shift based on customer interest and market conditions. This method helps capture more sales and increases profit margins.
Online retailers often use dynamic pricing during peak seasons or events. It allows them to raise prices when demand is high. Lower prices can attract buyers when sales slow down. Data guides these price moves to stay competitive and profitable.
Competitive price analysis compares your prices with rivals’. It uses data to spot gaps and opportunities. Knowing competitor prices helps set your own prices smartly.
This analysis prevents pricing too high or too low. Price too high, and customers go elsewhere. Price too low, and profits shrink. Data shows the sweet spot where customers feel good about buying.
Optimizing your product range helps you focus on items that bring the best profit. Data analytics reveals patterns in sales, customer preferences, and market trends. This information guides smart decisions about which products to keep, add, or remove. A well-optimized product range boosts sales and reduces costs.
Using data makes your product selection more precise and less guesswork. It helps balance variety with profitability. Let’s explore two key ways data analytics improves your product range.
Data shows which products sell well and which do not. You can reduce low-performing items and increase popular ones. This keeps your product mix fresh and appealing to customers. Adjusting the mix based on real sales data avoids overstock and waste. It also highlights niche products that might have hidden potential. A balanced mix attracts more buyers and raises profit margins.
Analytics tracks inventory levels and turnover rates. This helps prevent stockouts and excess stock. You can reorder best-sellers faster and slow down on slow-moving items. Managing inventory with data reduces storage costs and spoilage. It also improves cash flow by freeing up money tied in unsold products. Using insights from analytics ensures your stock matches actual demand.
Using data analytics to boost sales helps businesses find the most profitable products. It allows you to understand market trends and customer needs clearly. This approach guides smarter decisions and improves marketing efforts. Analytics turns raw data into valuable insights for better sales strategies.
Data analytics helps create focused marketing campaigns. It identifies the right audience for each product. This reduces wasted advertising spend. Campaigns reach customers who are more likely to buy. Personalized messages increase engagement and sales. Tracking campaign results also improves future efforts.
Understanding customer behavior is key to boosting sales. Analytics reveals buying patterns and preferences. It shows which products customers prefer and when they buy. Businesses can stock popular items and offer relevant promotions. This leads to higher customer satisfaction and repeat purchases. Data-driven insights help tailor the shopping experience effectively.
Using data analytics to find high-profit products offers great potential for businesses. Yet, several challenges can hinder the process. These challenges affect accuracy and decision-making. Understanding these obstacles helps improve strategies and results.
Data quality is a major challenge in analytics. Incomplete or incorrect data leads to wrong conclusions. Outdated information can misrepresent current market trends. Data from different sources may not align well. Cleaning and validating data takes time and effort. Poor data quality reduces trust in analytics results. Reliable data is essential for finding profitable products.
Data sets often contain complex patterns and relationships. Extracting meaningful insights requires skill and experience. Many variables influence product profitability. Separating useful signals from noise can be difficult. Visualization tools help but may not clarify everything. Misinterpreting data can cause costly mistakes. Clear understanding is key to effective product analysis.
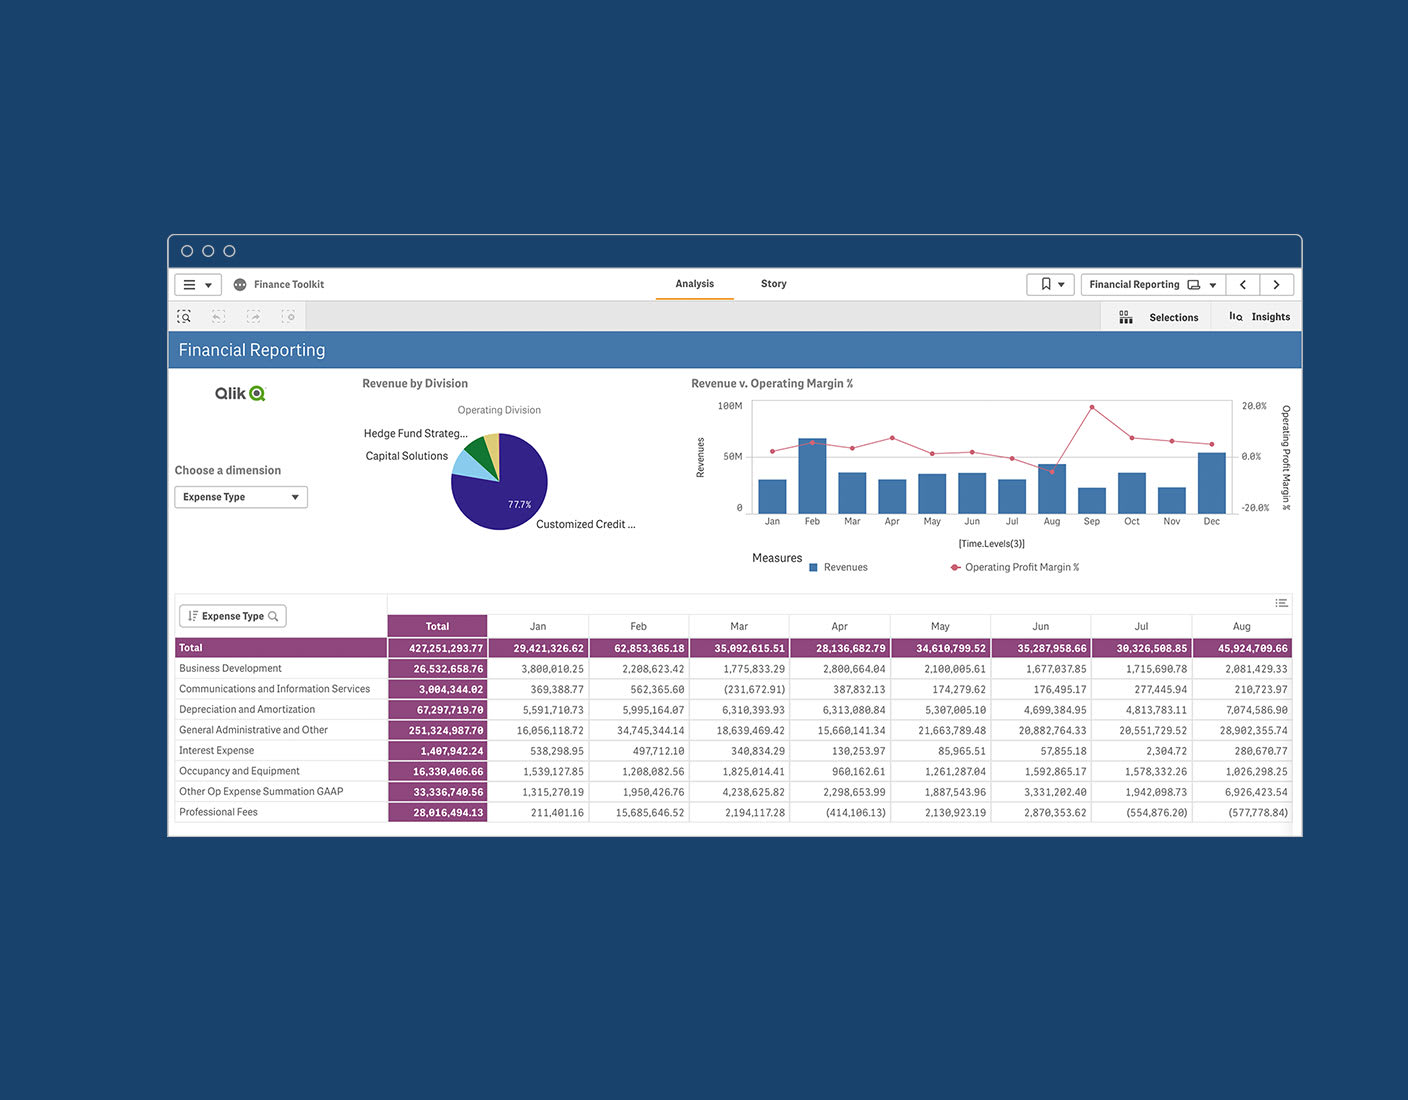
Credit: www.qlik.com
Product analytics is evolving fast. The future holds many new tools and methods. These changes help businesses find high-profit products easier and faster. Understanding future trends keeps companies ahead in the market.
AI and machine learning help analyze large data sets quickly. They find patterns that humans might miss. This technology predicts which products will sell well. It also suggests pricing and marketing strategies. Businesses use AI to reduce errors and save time.
Machine learning improves over time by learning from new data. It adapts to changing customer preferences. This makes product analysis more accurate and dynamic. Companies can make smarter decisions with less effort.
Real-time data allows instant views of product performance. Businesses can react quickly to market changes. For example, they can adjust stock levels or change promotions immediately. This reduces waste and boosts profits.
Access to live data improves customer satisfaction. Sellers can provide better service by meeting demand faster. Real-time insights create a flexible and responsive business model. This trend will grow as technology advances.

Credit: www.qlik.com
The 5 C’s of data analytics are: Collect, Clean, Connect, Calculate, and Communicate. They ensure accurate, actionable insights.
Use data analysis to identify profitable trends, optimize pricing, reduce costs, and target high-demand products. Create reports to guide decisions and boost revenue.
Analyze product profitability by subtracting all direct and indirect costs from total revenue. Positive results indicate profit. Use data analytics to identify cost drivers and optimize pricing.
The four types of data analytics are descriptive, diagnostic, predictive, and prescriptive. Each type answers different business questions.
Using data analytics helps identify products with the best profit potential. It shows clear trends and customer preferences. This knowledge guides smarter decisions and reduces guesswork. Tracking key metrics reveals which items bring higher returns. Regularly analyzing data keeps your product choices relevant.
Simple steps can lead to better sales and growth. Start small, learn often, and adjust your strategy. Data-driven insights make your business more competitive and efficient.


Leave A Reply Now