


If you’re creating custom software or tailored solutions, understanding how data moves within your system is crucial. Data Flow Diagrams (DFDs) give you a clear, visual map of how information travels from one part of your software to another.
By using DFDs, you can spot potential issues, improve communication with your team, and ensure your software works exactly the way you want. You’ll discover how DFDs can simplify complex processes and make your custom solutions more efficient and reliable.
Ready to take control of your software’s data flow? Keep reading to learn how!

Credit: www.conceptdraw.com
Data Flow Diagrams (DFDs) provide a clear visual of how data moves within custom software or solutions. They help teams understand processes and data exchange. DFDs simplify complex systems by breaking them down into easy-to-read diagrams. These diagrams show how data enters, flows through, and leaves a system.
Knowing the basics of DFDs is essential for designing efficient software. It helps avoid confusion and improves communication between developers and clients. Below are the key elements that form the foundation of any Data Flow Diagram.
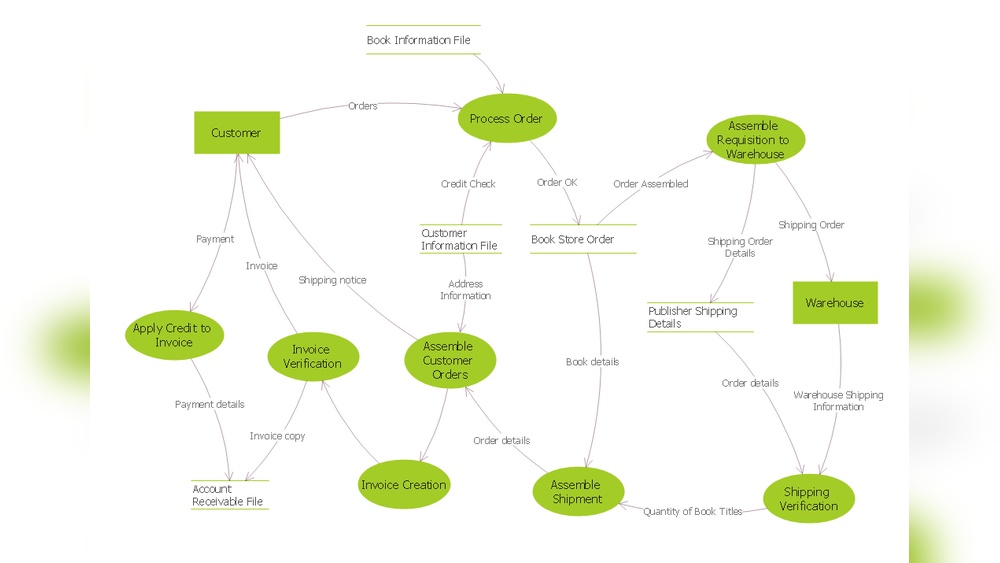
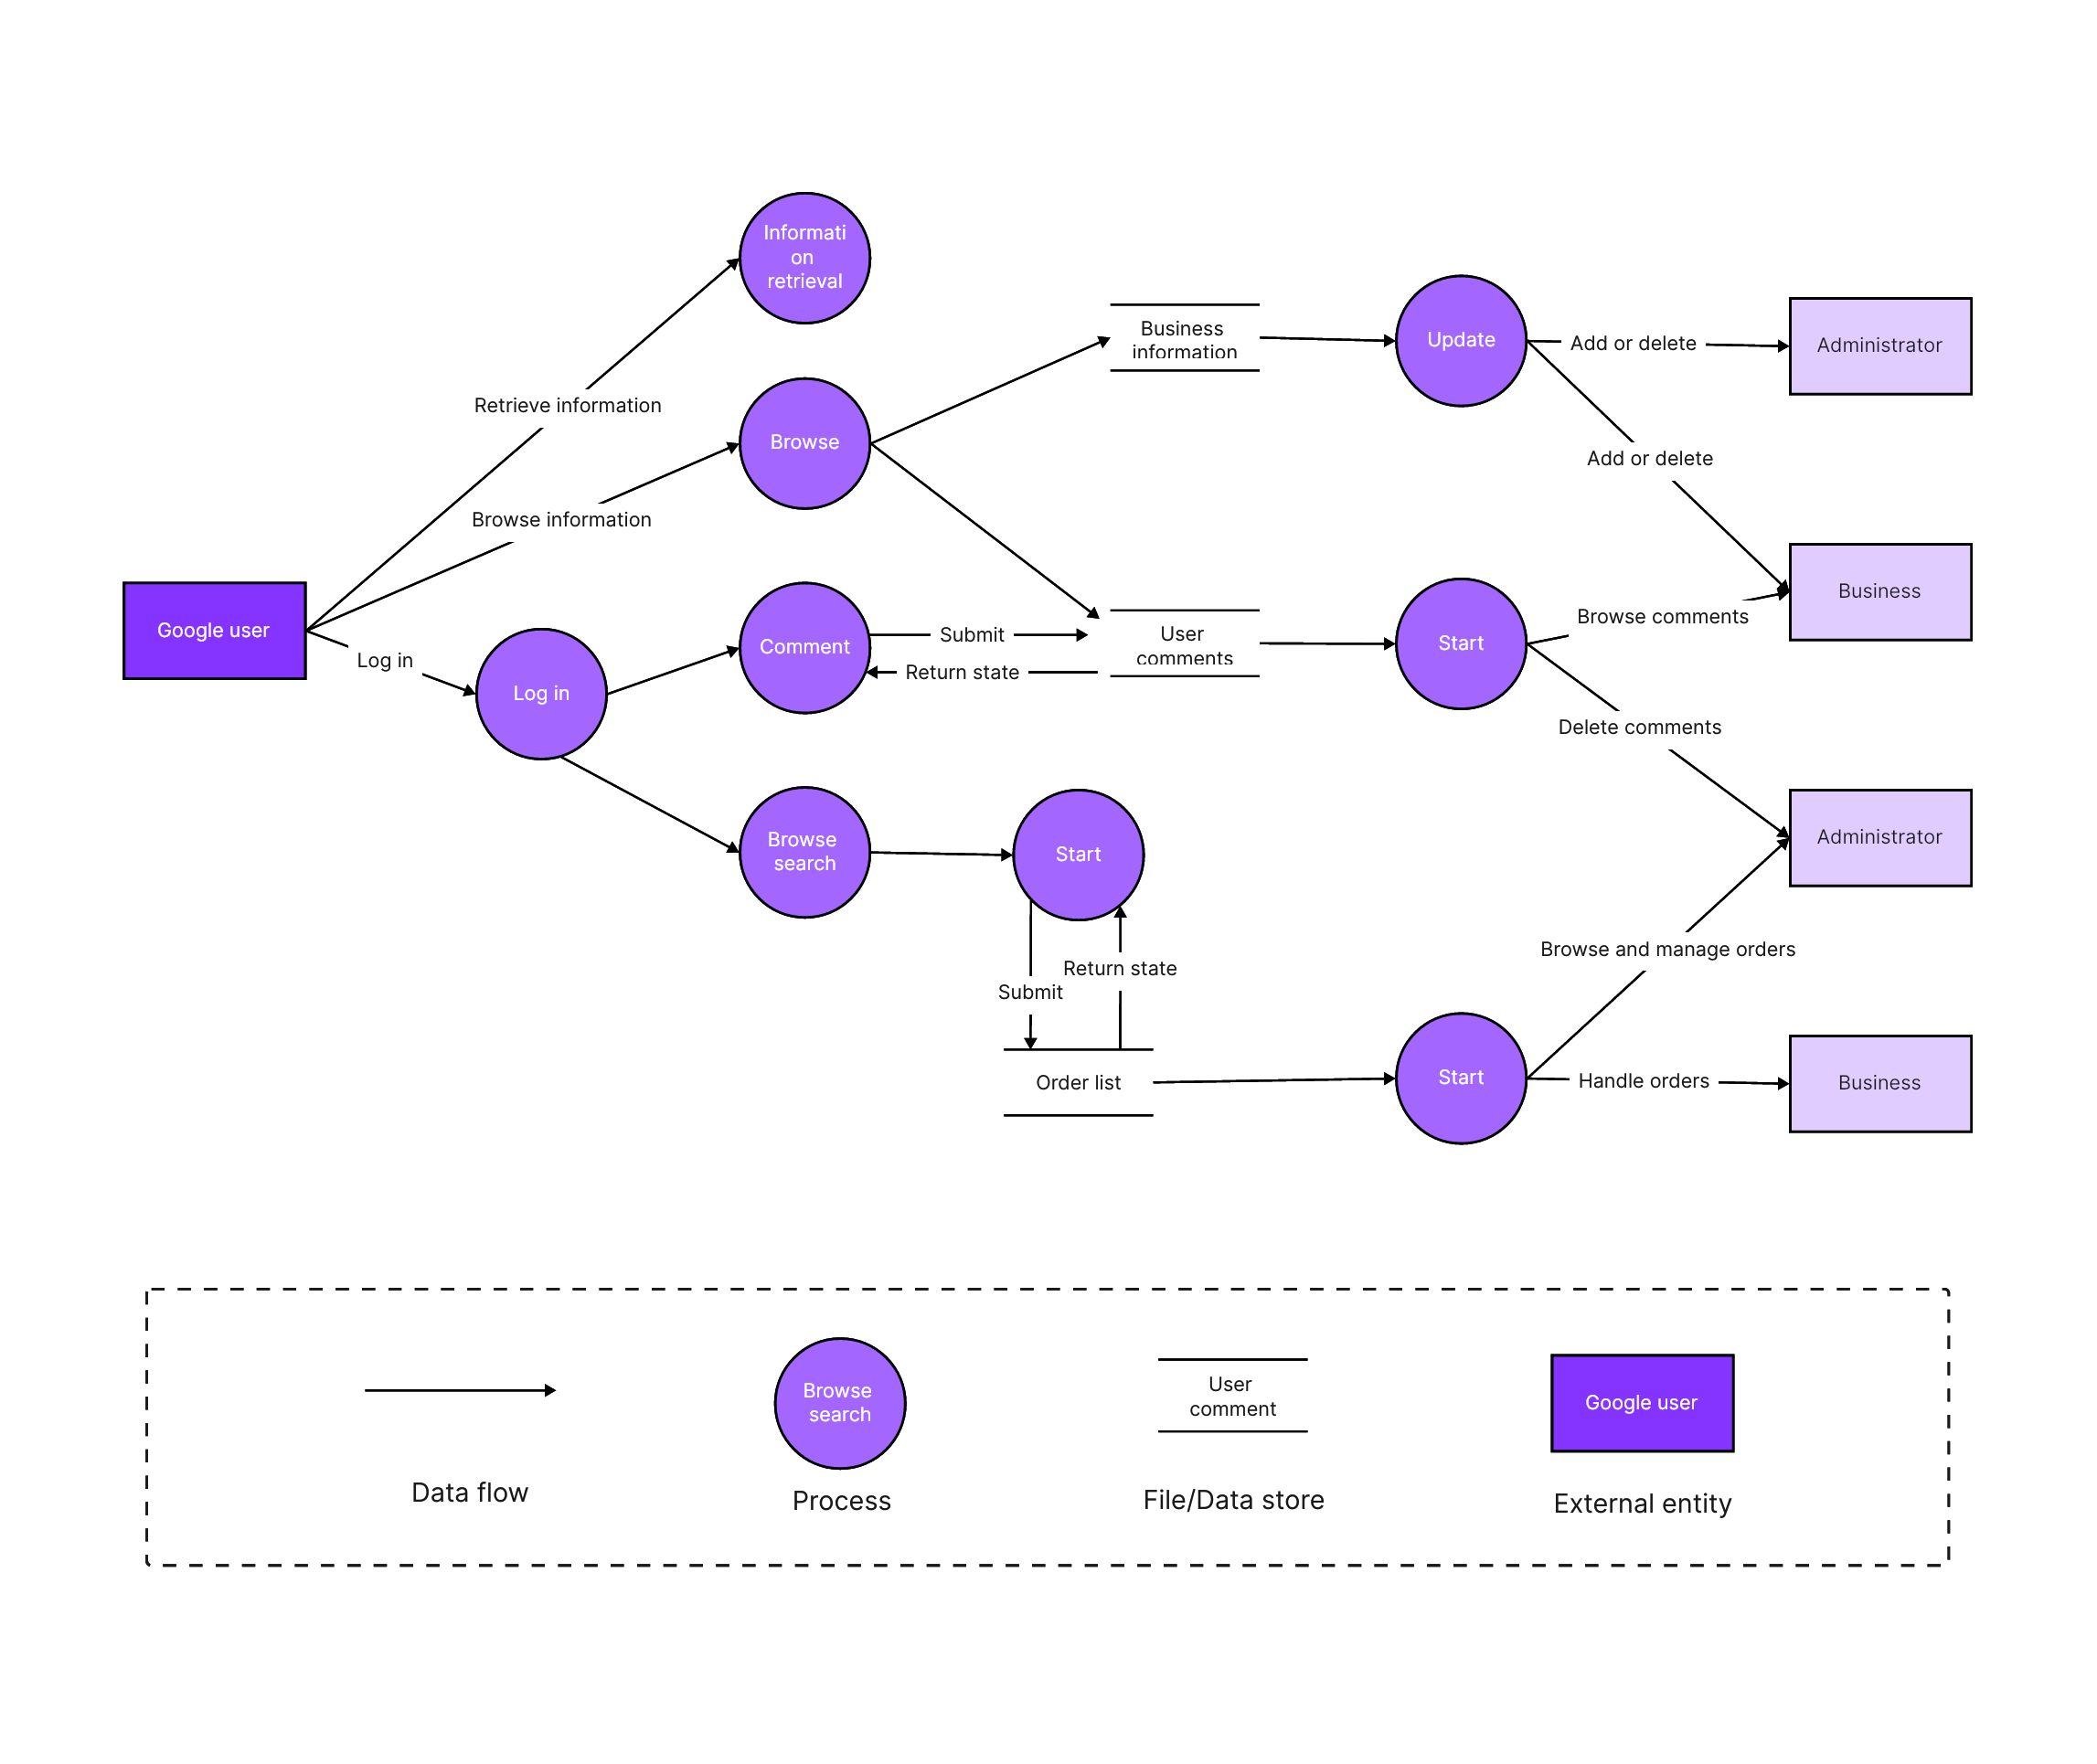
Data Flow Diagrams consist of four main components. First, Processes represent actions or tasks that transform data. Second, Data Stores are places where data is held temporarily or permanently. Third, External Entities are sources or destinations outside the system. Lastly, Data Flows show the movement of data between components.
Each component in a DFD uses specific symbols for clarity. Circles or rounded rectangles depict processes. Open-ended rectangles stand for data stores. Squares or rectangles represent external entities. Arrows indicate data flow direction. These simple symbols create a universal language for data mapping.
DFDs come in different levels to show detail gradually. Level 0, called a context diagram, shows the system as a whole with its interactions. Level 1 breaks the system into main processes with data stores and flows. Level 2 and beyond dive deeper into subprocesses and detailed data movements. This layering helps manage complexity step-by-step.
Credit: boardmix.com
Data Flow Diagrams (DFDs) play a crucial role in custom software development. They provide a clear picture of how data moves through a system. This helps developers and stakeholders understand the software’s processes. DFDs make complex systems easier to grasp by breaking them down visually. Using DFDs early in design can reduce errors and improve communication among teams.
DFDs help outline the software’s architecture. They show how data enters, moves, and exits the system. This visual guide supports better planning and decision-making. Developers use DFDs to spot inefficiencies and improve system flow. Clear diagrams lead to smoother development and fewer misunderstandings.
DFDs map how users interact with the software. They illustrate the inputs users provide and the outputs they receive. This helps ensure the software meets user needs effectively. Visualizing interactions makes it easier to design intuitive interfaces. It also highlights where user data flows within the system.
DFDs show the path data takes inside the software. They identify data sources, storage points, and destinations. This visualization helps detect data bottlenecks or security risks. Developers use this insight to optimize data handling and ensure smooth processing. Clear data flow maps simplify troubleshooting and future updates.
Creating effective Data Flow Diagrams (DFDs) is key for custom software projects. A clear DFD helps teams understand how data moves through the system. It also highlights interactions between processes, users, and data stores. Good DFDs improve communication and reduce errors during development.
Focus on simplicity and accuracy. The diagram should be easy to read but detailed enough to cover important data flows. Follow best practices to create DFDs that guide your software solutions successfully.
Start with a high-level overview, also called a context diagram. This shows the entire system and its external entities. Then, break it down into lower levels for more detail. Each level adds finer steps and data flows. Select the level based on your audience’s needs. Avoid too much detail for non-technical readers. Use detailed diagrams for developers and analysts.
Too much detail clutters the diagram and confuses viewers. Too little detail hides important data flows. Use simple symbols and clear labels. Group related processes to keep the diagram neat. Show only essential data stores and flows. Avoid crossing lines and overlapping elements. This makes the DFD easier to follow. Keep the focus on how data moves and changes.
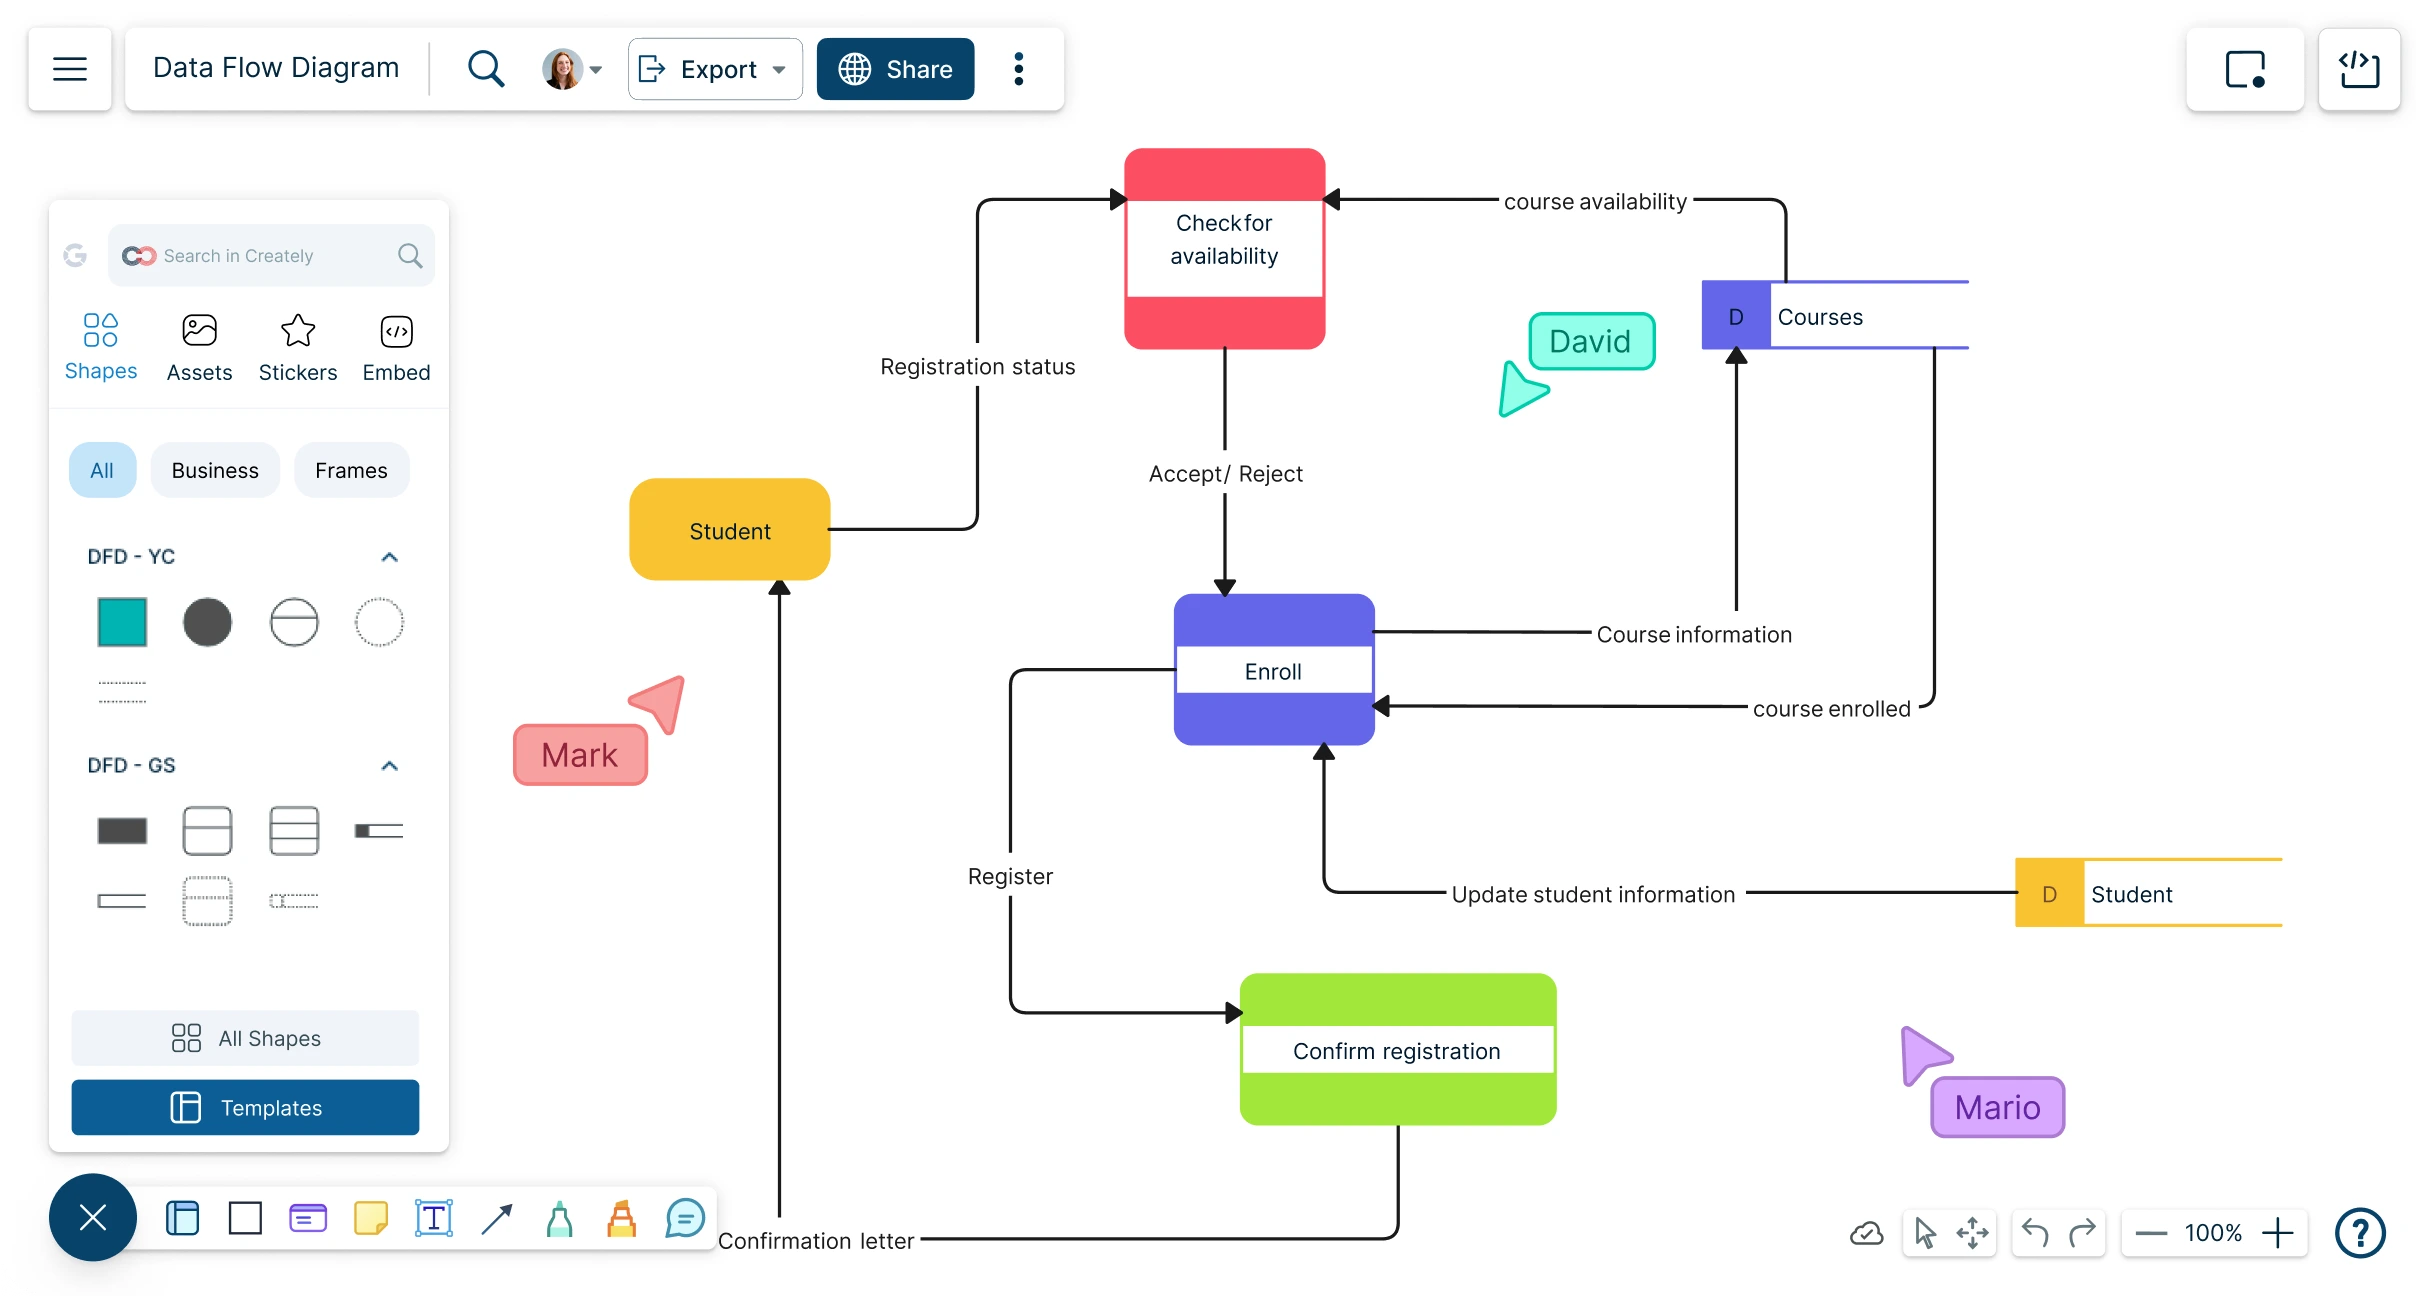
Many tools help create DFDs quickly and cleanly. Lucidchart offers an intuitive drag-and-drop interface. Microsoft Visio is popular for professional diagrams. Draw.io is a free and simple online option. Select tools that support DFD symbols and easy editing. Ensure the tool exports formats suitable for sharing and documentation. Good tools save time and improve diagram quality.
Credit: creately.com
Data Flow Diagrams (DFDs) are essential for designing clear custom software solutions. Following best practices ensures your diagrams remain accurate and useful throughout development. Well-crafted DFDs help teams understand data movement and system processes easily.
Applying best practices improves communication among developers, clients, and stakeholders. It reduces errors and streamlines the software design process.
Use the same symbols and notation throughout your DFD. Consistent shapes and labels make diagrams easier to read. Keep data flow arrows uniform in style and direction. Avoid mixing different diagram levels without clear distinction. Consistency helps everyone quickly grasp the system’s data flow.
Do not clutter diagrams with too many processes or data stores. Keep each DFD simple and focused on one system part. Avoid vague labels like “Process 1” or “Data.” Use clear, descriptive names. Ensure all data flows connect to a process. Missing connections confuse viewers and reduce diagram value.
Regularly revise your DFD as software evolves. Reflect changes in processes, data stores, or data flows promptly. Keep diagrams aligned with the current system design. Updated DFDs prevent misunderstandings and support accurate software implementation. Make it a routine part of your development cycle.
Advanced Data Flow Diagram (DFD) concepts deepen understanding of data movement. They help model complex software solutions with clarity and precision. Exploring these ideas improves system analysis and design. The following sections explain key advanced DFD topics.
DFDs often combine with other modeling tools. For example, Entity-Relationship Diagrams (ERDs) show data structure, while DFDs display data flow. Using both gives a fuller system view. Integration supports better communication among developers and stakeholders. It also reduces design errors by linking processes and data clearly.
Large software systems need layered DFDs. Start with a high-level overview, then break into detailed levels. This approach keeps diagrams easy to read and understand. It allows focus on specific parts without losing the big picture. Complex workflows and data interactions become manageable with this method.
Security is vital in custom software design. DFDs can highlight where sensitive data flows. They identify points vulnerable to data leaks or attacks. Marking these areas helps plan security controls. Encrypting data flows or adding authentication can protect the system. Clear security mapping reduces risks and builds trust.
Case studies provide clear examples of how Data Flow Diagrams (DFDs) improve custom software solutions. They show real-world applications and benefits. Understanding these cases helps businesses see the practical value of DFDs. Below are examples from different sectors and project sizes.
Large enterprises use DFDs to manage complex systems. These diagrams help map data flow across multiple departments. For example, a banking system used DFDs to track transaction processes. This improved data accuracy and reduced errors. The company saved time and costs in software development by using clear diagrams.
Small businesses benefit from DFDs by simplifying their software designs. A local retail store created a custom inventory system with DFDs. This made it easier to track stock levels and sales data. The visual flow helped staff understand system functions quickly. Small businesses can avoid costly mistakes by planning with DFDs early.
A healthcare provider developed patient management software using DFDs. These diagrams clarified data inputs from patients, doctors, and labs. The result was faster data processing and better patient care. Another example is an education app that used DFDs for user interaction flows. It enhanced user experience and increased engagement. Success stories like these prove DFDs’ value in custom software projects.
A Data Flow Diagram (DFD) visually represents how data moves through a system or process. It highlights inputs, outputs, data storage, and processing steps, helping to simplify complex software workflows and improve understanding for developers and stakeholders.
DFDs clarify system requirements by illustrating data movement and interactions. They enable better communication, reduce errors, and guide developers in designing efficient, user-focused custom software solutions tailored to specific business needs.
DFDs use four main symbols: arrows for data flow, rectangles for external entities, circles or ovals for processes, and open-ended rectangles for data stores. These symbols help create clear and standardized diagrams for software analysis.
Yes, DFDs help identify inefficiencies and data bottlenecks by mapping out current workflows. This insight supports process optimization and better integration of custom software solutions into existing business operations.
Data Flow Diagrams simplify complex software processes clearly. They help teams visualize data movement and system functions. Using DFDs improves communication between developers and clients. Clear diagrams reduce errors and speed up development. Custom software benefits from well-planned data flows.
Start using DFDs to make your software design easier. Simple visuals guide better decisions and smoother project progress.


Leave A Reply Now